Menu scans heatmap is now available to everyone and free of charge. It expands on existing statistics and looks more structured.
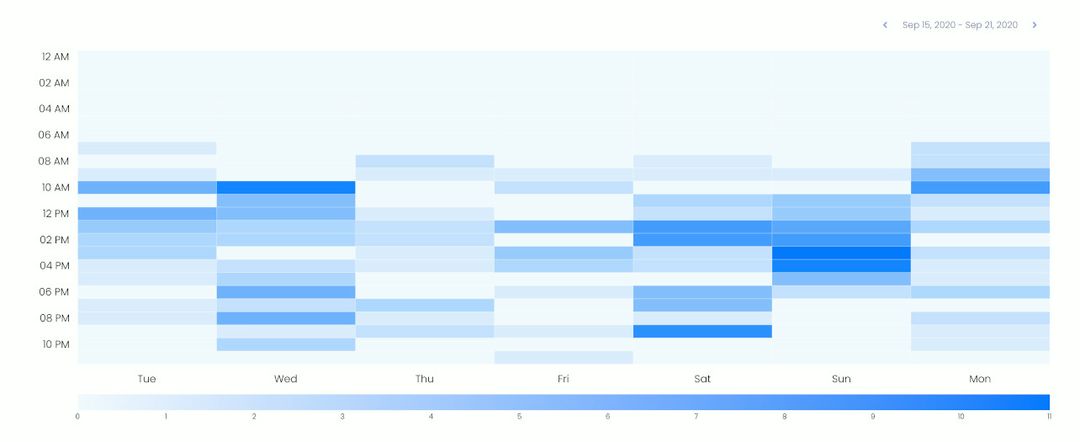
This report is useful for a number of reasons. It shows hourly statistics of digital menu QR code scans at your establishment, collecting data for the entire week. This allows you to observe and analyze how the workload of your tables changes depending on the days of the week and time of day.
The report is not limited only to the current week: if necessary, you can easily check what happened a week or a month ago.
To check the new statistics you need to do the following:
- Go to the Dashboard.
- Go down to the very bottom of the page that opens.
- There you will find the "Menu Views by Time of Day" section.
- Use the date selector to view another week.
Track popular hours and use them to increase your sales with new statistics from Stravopys.